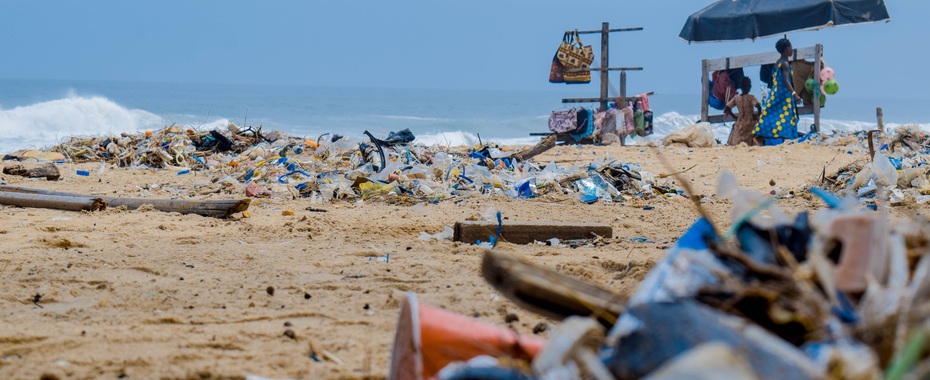
Key Stats Related to Plastic Waste
- 80% of all Plastic bottles, end up choking a fish or a sea bird in the ocean or burnt to release cancer causing toxins (NatGeo).
- 8 million tonnes of plastic is put in the oceans every year (UN, 2018).
- Only 10% of all plastic is recycled, 12% is burnt and 78% end up in landfills & oceans (Greenpeace).
- Plastic debris causes the death of more than 1 million sea birds and more than 1 lac marine mammals every year (Unesco).
- Bottled water requires 2000 times the energy used to produce tap water (NatGeo).
- The Great Pacific Garbage Patch, made up mostly of plastic waste has an area that is three times the size of France (Wikipedia, UN, NatGeo).
- In 2015, primary plastics production was 407 million tonnes; around three-quarters (302 million tonnes) ended up as waste
- 4 to 8 percent of global oil consumption is udes to make plastic.
Plastic Production
- In 1950 the world produced only 2 million tonnes per year. By 2019, annual production had increased nearly 230-fold, reaching 460 million tonnes
- Over the period from 1950 to 2019, cumulative production reached 9.5 billion tonnes of plastic - more than one tonne of plastic for every person alive today.
Plastic Waste
- Cumulative production of plastic over the period from 1950 to 2015 was 8300 million tonnes, out of this:
- 2500 million tonnes (30 %) of primary plastics was still in use in 2015;
- 4600 million tonnes (55 %) went straight to landfills or was discarded;
- 700 million tonnes (8 %) was incinerated;
- 500 million tonnes (6 %) was recycled
- Of the 5800 million tonnes of primary plastic no longer in use, only 9% has been recycled since 1950.
Countries producing the most total plastic waste
- Countries producing the highest daily per capita plastic waste are: Kuwait, Guyana, Germany, Netherlands, Ireland, the United States
- Countries producing the lowest daily per capita plastic waste are: India, Tanzania, Mozambique and Bangladesh.
- The difference of total plastic waste is more than 10 times between the highest and the lowest.
Countries producing the most mismanaged plastic waste
- Per capita mismanaged waste in the Philippines is 100 times than in the UK.
- On multiplying by population - India, China, the Philippines, Brazil, and Nigeria top the list of countries producing the most mismanaged waste.
(Mismanaged Waste is material which is at high risk of entering the ocean via wind or tidal transport, or carried to coastlines from inland waterways)
Plastic Use By Sector (2015)
- Packaging Industry - 146 million tonnes (42%)
- Building and Construction Industry - 65 million tonnes (18%)
- Textiles Industry - 59 million tonnes (16%)
- Consumer & Institutional Products - 42 million tonnes (12%)
- Transportation - 27 million tonnes (7%)
- Electrical/Electronic -18 million tonnes (4%)
- Industrial Machinery - 3 million tonnes (1%)
Plastic Pollution of the Oceans
- Plastic pollution of the Oceans can arise from land (coastlines and rivers) and from marine sources (fishing nets, ropes, lines and abandoned vessels).
- 20-30% of ocean plastics come from marine sources
- 70-80% from land(coastlines and rivers)
- Nearly 95% of river inputs arise from Asia (86%) and Africa (8%).
- 82 million tonnes of macroplastics and 40 million tonnes of microplastics – is washed up, buried or resurfaced along the world’s shorelines.
Regions that emit the most plastic into the oceans
- Asia 80.99%
- Africa 7.99%
- South America 5.51%
- North America 4.5%
- Europe 0.6%
- Oceania 0.37%
Share of global plastics emitted by Rivers to the ocean – Top Ten, 2019
- Pasig (Philippines)– 6.43%
- Tullahan (Philippines) - 1.33%
- Ulhas (India) - 1.33%
- Klang (Malaysia) - 1.33%
- Meycauayan (Philippines) - 1.23%
- Pampanga (Philippines) - 0.95%
- Libmanan (Philippines) - 0.72%
- Ganges (India) - 0.63%
- Rio Grande de Mindanao (Philippines) - 0.54%
- Agno (Philippines) - 0.47%
(Data on plastic production, waste, plastic pollution of the oceans is sourced from: Science Advances, Royal Society Open Science, Scientific Reports from Nature, PLOS One, UNEP & FAO, Annual Review of Marine Science, Environment, Science & Technology, Our World in Data, Marine Environmental Research and Science Direct.)
